Samples / Task 1 Academic report / Line graph / Band 7
Average Household Electricity Use 2000 to 2020
A Band 7 IELTS Academic Writing Task 1 report analyzing household electricity consumption across four countries from 2000 to 2020.
The question
The graph below shows average household electricity use in four countries between 2000 and 2020. Summarise the information by selecting and reporting the main features, and make comparisons where relevant. Write at least 150 words.
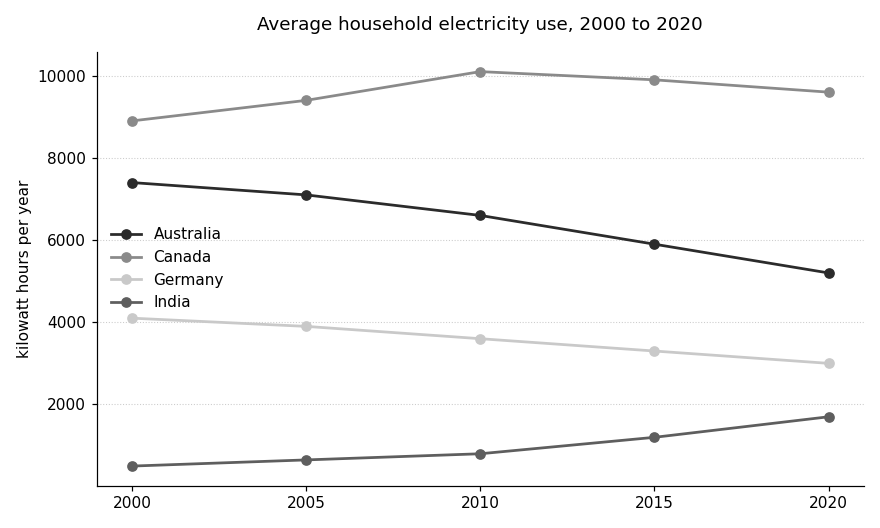
Categories (kilowatt hours per year): 2000, 2005, 2010, 2015, 2020
Australia: 7400, 7100, 6600, 5900, 5200
Canada: 8900, 9400, 10100, 9900, 9600
Germany: 4100, 3900, 3600, 3300, 3000
India: 500, 650, 800, 1200, 1700
This answer was written by a language model to a real exam question, then scored by Bandly against the four public band descriptors. The band is a software estimate. No examiner has marked it, and the band a real examiner would award may differ. Scored with google/gemini-3.5-flash on 2026-09-08.
What would take this higher
To improve your Coherence and Cohesion score to a Band 7, you should focus on making your transition words and referencing feel more natural and less mechanical. For instance, instead of relying on repetitive linking words like "Similarly" and "In contrast" to start sentences, you could integrate your comparisons more smoothly, such as by combining the sentences about Germany and Australia to show their shared downward trend. Additionally, correcting awkward cohesive structures, such as the final sentence where "while the figures for India shows" creates a confusing connection, would help establish a much clearer and more sophisticated flow of information.
Find out what this essay would score
Paste your own answer and Bandly returns an estimated band for each of the four criteria, with the sentences that pulled the score down. Under a cent an essay, about six seconds.
Check my essayMore at this level
Household Recycling Rates in Five Countries (2005 and 2020)
An IELTS Academic Task 1 answer describing recycling data with characteristic band 6.5 grammatical, lexical, and cohesive features.
Advantages and Disadvantages of Mobile Phones
An IELTS Academic Task 2 essay exploring the pros and cons of mobile phones, written at a Band 6.5 level.
Television: Advantages, Disadvantages, and Personal Perspective
An IELTS Academic Task 2 essay discussing the pros and cons of television globally, written at a Band 7 level with typical candidate errors.