Samples / Task 1 Academic report / Bar chart / Band 7.5
Commuter Transport Preferences in Tokyo, Amsterdam, and Houston (2023)
An IELTS Academic Writing Task 1 sample report analyzing commuting habits in three major global cities in 2023, featuring a band 7.5 model answer.
The question
The chart below shows the percentage of commuters using four types of transport in three cities in 2023. Summarise the information by selecting and reporting the main features, and make comparisons where relevant. Write at least 150 words.
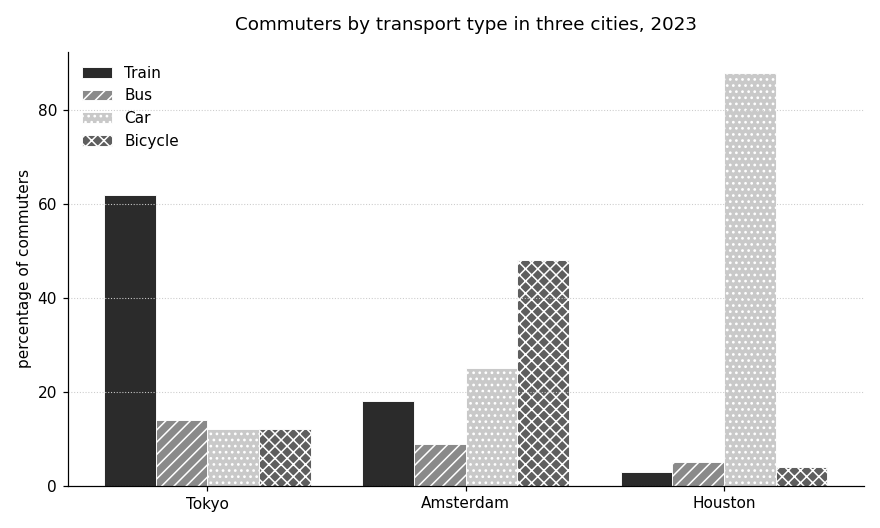
Categories (percentage of commuters): Tokyo, Amsterdam, Houston
Train: 62, 18, 3
Bus: 14, 9, 5
Car: 12, 25, 88
Bicycle: 12, 48, 4
This answer was written by a language model to a real exam question, then scored by Bandly against the four public band descriptors. The band is a software estimate. No examiner has marked it, and the band a real examiner would award may differ. Scored with google/gemini-3.5-flash on 2026-09-08.
What would take this higher
To potentially improve your Coherence and Cohesion score to a band 8, you should focus on varying your cohesive devices and integrating them more naturally. For instance, instead of starting paragraphs with predictable transitions like "In Tokyo" or "Amsterdam exhibited", you could use referential pronouns or adverbial phrases that link the data points more fluidly across paragraphs. Additionally, substituting repetitive structures like "accounting for" and "utilized by" with more diverse linking words would help create a more seamless flow of information.
Find out what this essay would score
Paste your own answer and Bandly returns an estimated band for each of the four criteria, with the sentences that pulled the score down. Under a cent an essay, about six seconds.
Check my essayMore at this level
Municipal Water Treatment Process Academic Report
A Band 7 model answer describing the process of producing drinking water at a municipal treatment plant, featuring realistic candidate errors.
GT Task 1 Letter: Letter to a Neighbour About Late-Night Noise
A practice letter to a neighbour addressing late-night noise issues, written to demonstrate a realistic Band 7 performance under exam conditions.
Requesting Two Weeks Off for a Family Matter
A Band 7.5 IELTS General Training Task 1 response requesting leave from a manager, demonstrating clear purpose, appropriate tone, and minor grammatical slips.